Excel - Indirect Cell References

If you work a lot in Excel, you’re probably familiar with VLOOKUP/HLOOKUP/XLOOKUP functionality which allows you to pull data from an array into your spreadsheet. This functionality is very powerful when working with large dataset on a single tab in a workbook - you simply define the array you want to reference and the column number you wish to return data from (i.e. VLOOKUP($B5,’Division A’!$B:$C,2,FALSE).

But what if that reference (‘Division A’!$B:$C) is variable? Perhaps you get similar datasets from multiple divisions, so you are presented with one tab for each division and you want to be able to quickly change among division’s tabs to review.

Division_1.JPG

You could do a Find/Replace (Ctrl-H) to replace ‘Division A’ with ‘Division ‘B in the VLOOKUP formula each time you wish to change your view. But a better way is to use the INDIRECT function to make the reference array contingent upon the title of your column.

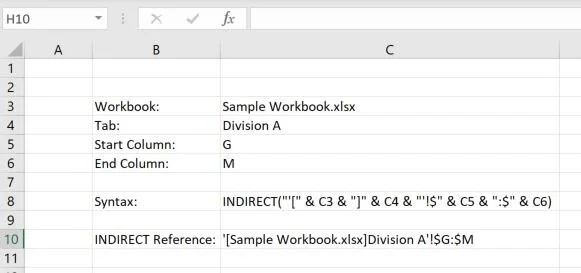
You just need to convert the reference string (‘Division A’!$C:$F) into a text string where ‘Division A’ is a variable. The INDIRECT function syntax is very simple (INDIRECT(ref text)) so we can just build a text string to emulate the reference string. Cutting to the chase, this is what that string will look like:

  • INDIRECT("'" & $C$4 & "'!$B:$C")

Where:

  • $C$4 is the text: Division A (for now)

  • The opening and closing single quotes are enclosed in double quotes (like any Excel text) along with the tab reference exclamation point and column references ($B:$C)

  • & symbol is used to connect multiple text strings

Then we plug that INDIRECT function into the VLOOKUP as follows:

  • VLOOKUP($B5,INDIRECT("'" & $C$4 & "'!$B:$C"),2,FALSE)

Now when we change the title of the column, the formulas update to pick up data from the correct tab.

Using the INDIRECT function, we can make every element of the a reference array variable - if need be. For example:

Division_2.JPG

This is only a sample of how this function can be used.

Always remember: Excel Can Do Anything. You just need to think through what you need the tool to do and how to break it down into logical chunks. If you have an Excel brain teaser I can help with, please email me at: matt@redbladesolutions.com

Getting an 'A' isn't good enough!

In most classes, if you get 90% of the answers right you get an A. And that’s pretty good! A straight A student is right 90% of the time. But there are lots of times when this isn’t good enough.

Consider the example of a symphony orchestra.

If there are 100 players in the orchestra and each is right 90% of the time, then at any given point in the performance 10 people are playing the wrong note. Even an untrained ear would notice that. At 99%, the there is consistently one wrong note being played - constantly. Orchestra’s operate at a much higher level of accuracy than that - and so should you.

That level of accuracy is not a result of having an excellent conductor (leader). It’s a result of the accumulated skill and practice of each orchestra member. Each member is an expert at playing their instrument. Not only are they getting a remarkably high percentage of the notes right, but they are doing so with near perfect timing, articulation, volume, and tone.

Typically, in business, the work of lower level employees is reviewed by managers before being shared further. There is no such check in an orchestral performance - the first draft goes ‘out the door’. All team members regardless of level should be focused on executing at the highest level without relying on others to check their work. Of course, work should still be checked, but that shouldn’t be the first line of defense.

Businesses stress ‘attention to detail’ as a desirable attribute - Let the example of an orchestra help to guide your understanding of what that truly means and consider how you might instill this attribute as a core competency in your teams.

Principles

RedBlade Solutions believes that all business decisions have financial impacts, but not all decisions are financial decisions. Much of what you’ll see here will be focused on financial impacts of decisions, but the theory can be applied more broadly.

Regardless of what kind of information you are working with, that information doesn’t exist in a vacuum. Context is always critical to making raw data actionable. If, for example, you tell me that your Travel & Entertainment expenses for the month of June is $5K, a bunch of questions come to mind.

  • What did we spend that money doing?

  • Was the spend higher or lower than expected or a surprise?

  • If it was a surprise, what implications does that have for meeting our objectives for the year?

  • Will we have to spend less next month in order to meet an expense target?

  • Did the spend lead to an opportunity that will improve our overall prospects?

  • How does that level of spending compare to previous spending? Last month? Last quarter? Last year?

  • When the bill comes due, will I be able to pay it?

Similar questions can be applied to non-financial information like Sales Opportunities, Hiring, Delivery Schedules, Customer Experience/Satisfaction and other business activities. What you choose to track depends on what is critical to your business. This blog will focus on some of the key tools to evaluate information.

  • Period to Period Comparisons

  • Actual vs. Target (Budget, Forecast, etc.) Comparisons

  • Comparative Bridges – identifying the key drivers of changes between periods or Act vs Tgt

  • Risks & Opportunities Schedules – action plans to mitigate risks and/or exploit opportunities

  • Key Performance Metrics (KPIs) – metrics to track progress in a standardized manner

Introduction

Information requirements vary greatly by the type of business you run and by where you are in your business lifecycle. For example, if you’re just starting out, you will probably just be excited when your financial reports tell you that you have paid all of your bills and that there’s still money in the bank. If you’re a large established business, then you’ve probably have a pretty clear picture of where all your money went but may want a better way to understand what the future looks like. In either case, RedBlade Solutions can help you.

At RedBlade Solutions, we work with the people, processes and systems you already have to maximize their value.

  • If you don’t have the data you need, we can help you develop a way to collect it

  • If you have the data but reporting is unclear, we can help you develop simple analytics to determine what is happening

  • If you have lots of reports from different sources, but none of them seem to relate to each other or appear contradictory, then we can help straighten out the relationships, understand where reports differ and why you may or may not want to make them more similar

  • Once you have improved your understanding of the business, RedBlade solutions can help you communicate throughout the company to enhance performance and drive results

In the articles that follow, we will take a look at different elements of information handling to give you some ideas about how you might like to run your business. Use the ideas on your own if you wish. But if we can help to implement some of the ideas you like, we look forward to working with you.